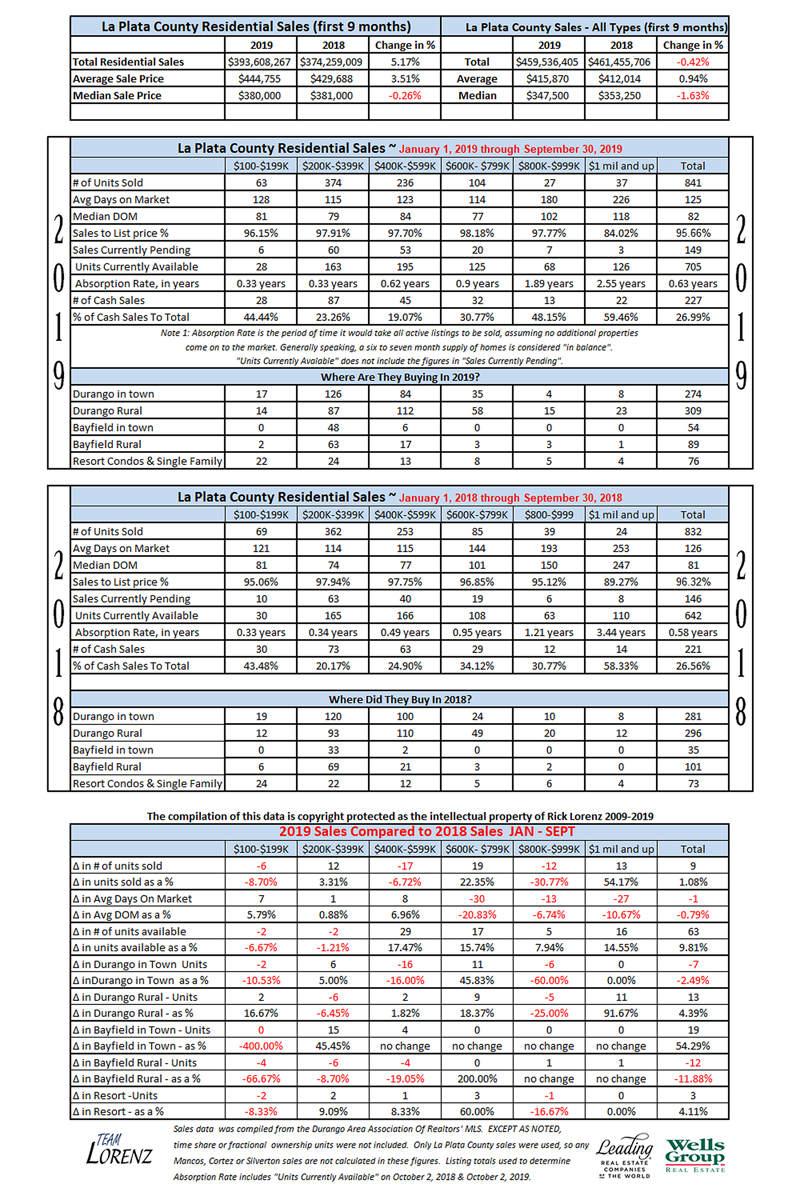
Durango Real Estate Comparative Statistics 2018-2019 First 9 Months

Total Residential Sales volume year-to-date for this year increased by 5.17% over last year while the number of units sold increased by 9 homes which was only a 1.08% increase. That figure of number-of-units-sold continues the trend that began about three years ago of reasonably flat sales. By that, I mean we are not getting huge spikes up or huge collapses downward either.
A couple of other numbers jumped out at me. The number of units sold between $400,000 – $600,000 dropped by 17 units this year but the next category, $600,000 – $800,000 increased by 19 units sold. I think that reflects a continuing firming-up in that higher price category as well as a movement of the homes that used to be in the high $500,000 range that have now “crept” into the $600,000 – $800,000 price bracket. That same sort of “bracket creep” as we call it, appeared to have occurred in the $800,000 – $1 million price bracket which showed a decline of 12 units but in the over $1 million price bracket there was an increase of 13 units sold.
The sales to list price percentage is stronger this year than last even though in the $1 million and up price bracket there was a decline. That decline, however came about because of some very high-end auction properties that essentially sold at $0.50 on the dollar.
